
The short answer
Compare hourly flow at each labelled outlet, not raw collected volume. Convert each round with L/h = millilitres × 3.6 ÷ seconds, then keep the paired results and any changed conditions together. A change in flow does not, by itself, prove what caused it.
Applies toAccessible outlets on domestic surface drip systems. Compare the same outlets in two rounds; this small-sample record is not a professional uniformity assessment, a pressure test or a watering schedule.
You have cleaned a filter or corrected an accessible fitting and want to know what changed. A photograph of wet soil will not answer that question. This guide gives you a repeatable comparison, a tool for up to six outlet pairs, and a record you can download before leaving the page. The arithmetic examples are invented to explain the method; no field test is claimed.
01Keep the same outlet on both sides of the comparison
Give each sampled outlet a stable label such as A at the first plant, B beside the gate and C at the line end. Use the same physical outlets in the second round. If you replace an emitter, record its old and new rating: a change from a 2 L/h product to a 4 L/h product changes the comparison itself.
University of California guidance explains why sample location and operating block matter. For this smaller home-garden record, choose locations that answer your specific question, then keep that limited scope visible. Three easy-to-reach outlets do not represent every branch, slope or buried section of an installation.
Based on source 1.
02Write the baseline before doing the maintenance
Record the running zone, outlet settings, elapsed time and volumes before the intervention. Keep an observation such as “C collected 60 mL in 180 seconds” separate from a proposed explanation such as “C is blocked”. The first can be checked later; the second still needs investigation.
For a practical before-and-after check, note any obvious existing problem rather than pretending the system was already operating normally. This is a change record. A formal system evaluation has its own preparation and sampling requirements. Follow the exact product instructions for any cleaning or adjustment, and record that work between the two rounds.
Based on source 1.
03Convert both rounds to an hourly rate
The conversion comes from the units: divide millilitres by 1,000 to get litres, divide by elapsed seconds, then multiply by 3,600 seconds per hour. Combined, flow in L/h = mL × 3.6 ÷ seconds. For a 180-second collection, 100 mL becomes 2 L/h. A 300-second collection of 167 mL becomes 2.004 L/h.
Different collection times between rounds are mathematically acceptable when the operating conditions are otherwise comparable and each actual time is recorded. Within a round, the tool uses one duration for all outlets. If one container was removed early, repeat that sample or analyse it separately with its actual duration. Do not assign the full-round time to a shorter collection.
04Check the result that a larger container reading can hide
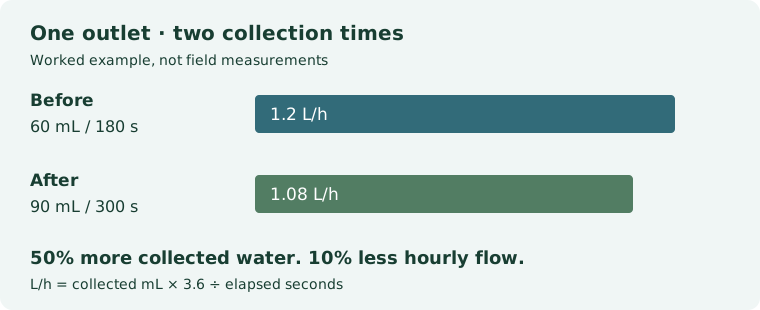
Take the far outlet in the worked example below: before, 60 mL in 180 seconds; after, 90 mL in 300 seconds. Collected volume rose by 30 mL, or 50%. But the collection lasted longer. The rates are 1.2 and 1.08 L/h, so flow fell by 0.12 L/h, or 10%. Raw volume alone gives the wrong direction.
That is why the report keeps both the original observations and the calculated rates. A rounded summary is convenient for reading, but the raw volumes and times allow another person to reproduce the calculation. When downloading the CSV, retain the metadata rows as well as the outlet table.
05Read individual pairs before reading the average
A mean can stay nearly unchanged while the distribution changes. Consider a separate invented example with three rates of 2, 2 and 1 L/h before, then 1, 2 and 2 L/h after. Both means are about 1.667 L/h. One outlet fell, another rose and the middle stayed the same. Reporting only the mean would erase the useful location information.
The tool therefore lists each outlet, both rates, the absolute change and the percentage change. Its mean is the arithmetic mean of sampled outlets, not the total demand of the zone. Adding up three sampled flows is not a way to estimate a line containing many unmeasured outlets.
The smallest-to-largest ratio describes these samples only. It does not use a professional low-quarter sampling procedure and is not labelled as a distribution-uniformity score. A higher ratio can even occur because the best outlet weakened: compare 2/2/1 L/h with 1/1/1 L/h. The ratio rises from 50% to 100%, while every changed outlet delivers less water.
06Handle zero, missing samples and tiny changes honestly
A zero means you watched the complete collection interval and no water was collected. A knocked-over container, missed outlet or unfinished collection is missing information. The tool rejects half-filled pairs and skips only fully empty rows. If a sample was lost, repeat it or exclude that complete pair and note the exclusion.
Percentage change from zero is undefined because the calculation divides by the before value. A transition from 0 to 1 L/h is recorded as those two rates and a +1 L/h change, without an invented percentage. If all after samples are zero, first confirm that the zone was running and the collection method worked.
A calculated increase of 0.004 L/h is not automatically an improvement. Graduation marks, timing, drips left in the container and operating changes limit what you can distinguish. The tool has no information about your instrument accuracy and cannot assign statistical significance or a universal pass threshold. Repeat a surprising result before acting on it.
07Use the change to choose the next observation
Record other water use, changed valve settings, different running zones and replacement emitters. If more than the maintenance action changed, retain both rounds as observations and leave the cause unresolved. Even when no other change is known, a single before-and-after pair cannot rule out unrecorded variation.
A repeated difference across comparable outlets can guide a further check of layout, filtration or operating pressure against the product requirements. Outlet flow alone does not tell you the pressure at the emitter. Pressure measurements need suitable equipment and a compatible procedure; the calculator cannot reconstruct them.
Equal flows also do not establish that the plants receive the right amount of water. Emitter placement, root coverage, soil and plant needs remain separate questions. Use the uneven-watering guide for the next delivery check, rather than increasing the timer solely because one comparison looks low.
08Leave with something you can repeat next time
Download the comparison CSV or print the generated report as a PDF. Include a sketch with outlet labels, the action between rounds, and anything that changed in the running setup. The tool starts empty and does not automatically retain your entries. Reloading or leaving the page loses them unless you exported a copy.
The blank CSV worksheet also works without the calculator. Write the two durations and collected volumes in its columns, then use the formula above on paper or in a spreadsheet. For a follow-up visit, repeat the same labelled outlets and keep the earlier record instead of overwriting it. A useful conclusion may be “the result did not repeat”; that is better evidence than forcing a diagnosis.
Your measurements, kept together
Before-and-after drip check
Compare the same accessible outlets in two rounds. Each round can have a different collection time: the tool converts both to L/h before comparing them. Use millilitres and seconds throughout.
Your entries are processed in this page. The tool does not send them to our server or automatically save them. Download or print a report before leaving. A small sample is not a professional uniformity audit, a pressure measurement or a plant-watering prescription.
Check the arithmetic yourself
More collected water can still mean less flow.
This invented example uses 180 seconds before and 300 seconds after. It demonstrates the calculation; these are not results of a YardOnAuto field test.
| Outlet | Before: mL / 180 s | After: mL / 300 s | Flow: before → after |
|---|---|---|---|
| Near | 100 | 167 | 2 → 2.004 L/h |
| Middle | 95 | 160 | 1.9 → 1.92 L/h |
| Far | 60 | 90 | 1.2 → 1.08 L/h |
The far outlet collected 50% more water, but for longer. Its hourly flow fell by 10%. The three-outlet mean changed from 1.7 to 1.668 L/h, a fall of about 1.88%. Comparing raw volumes would reverse the conclusion for that outlet.
Download a blank measurement worksheet (CSV). Open it in a spreadsheet or print it and fill it in beside the system.
Take a useful record away
Before-and-after field record
Use this paper record when the tool is unavailable. Keep missing samples distinct from observed zero collections.
- Zone name, outlet labels and locations on your sketch
- Before round: collection seconds and volume in mL at each labelled outlet
- Maintenance action and other known changed conditions
- After round: collection seconds and volume in mL at the same outlets
- For each pair: before / after L/h, absolute change, and next observation
Use your browser’s Print command, or “Print guide” at the top, to print or save a PDF.
Check the original guidance
Sources & verification
Sources checked on . First published . Follow the manual for your exact model if its instructions differ.
- University of California ANR: sampling locations, discharge collection and system evaluation
- Utah State University Extension: drip layout, emitter placement and plant water needs
Diagrams and the order of checks are YardOnAuto’s explanatory presentation of the cited guidance, not manufacturer installation drawings.
Our editorial method