
The short answer
Collect water from comparable outlets for the same measured time, label each location and convert volume to hourly flow. In metric units, litres per hour = collected millilitres × 0.06 ÷ elapsed minutes.
Applies toAccessible outlets on domestic surface drip systems. Compare like-for-like emitters within the same running zone. This is a small-sample observation, not a professional distribution-uniformity audit.
A damp patch tells you where water landed; a timed collection tells you how much left a particular outlet during that interval. This guide provides the arithmetic and a simple recording method so that your next check can use the same conditions.
01Choose locations that answer one question
UC Agriculture and Natural Resources describes measuring discharge across the layout and keeping the sample positions identifiable. For a small home-garden check, choose comparable outlets near the beginning, middle and end of one line. If a separate branch is the concern, sample that branch separately rather than mixing two investigations.
Make your comparison explicit: “Does the far end deliver less than the near end while this zone runs?” Do not compare a 2 L/h emitter with a 4 L/h emitter and interpret the difference as a fault. Adjustable outlets also need comparable settings. Mark the actual positions on a sketch, including a branch or slope when relevant.
Read the pattern along the line
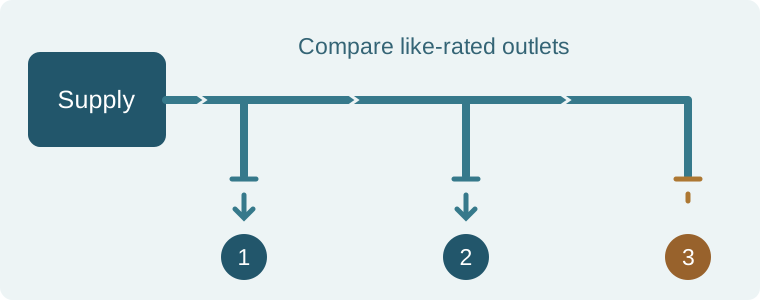
- 1Near the supply
- 2Middle of the line
- 3Far end of the line
Based on source 1.
02Collect without changing the test halfway through
Let normal operation establish, then collect the complete accessible discharge from each selected outlet for an equal measured interval. Keep the containers below the outlets without bending or pinching the feeding tubes. Watch for splashes, spills and overflow; a compromised collection needs repeating rather than estimating.
For the worked calculation here we choose three minutes. That is an example interval, not a manufacturer rule: select a duration that gives a readable volume without overflowing your containers. A tiny collected amount can make a coarse measuring jug unhelpful. Record the actual elapsed time, even if it differs from your plan.
Simultaneous collections help keep operating conditions comparable. If you collect sequentially, keep the same zone configuration and note other water use or changes in the supply. Record an uncollected or spilled sample as missing, not zero. A zero is meaningful only when you observed no collected water for the full interval.
03Convert the volume, keeping the time units visible
Start from volume divided by time. Convert millilitres to litres by dividing by 1,000, then convert a per-minute rate to a per-hour rate by multiplying by 60. Combined, the conversion is mL × 0.06 ÷ minutes. A three-minute sample of 100 mL gives 100 × 0.06 ÷ 3 = 2 L/h.
Illustrative samples of 100, 95 and 60 mL over three minutes therefore give 2, 1.9 and 1.2 L/h. Their arithmetic mean is 1.7 L/h. The smallest is 60% of the largest. These numbers are a worked example, not measurements from a YardOnAuto test. The calculator below performs the same conversions for your observations.
US gallons per hour are litres per hour divided by approximately 3.78541. Keep US gallons distinct from imperial gallons. Rounding is for display; it does not make a short collection more precise than the timer and measuring container allow.
04Use a difference to choose a check
The three-point comparison is descriptive. Its minimum-to-maximum ratio is not a distribution-uniformity score, a pass threshold or proof of a particular fault. An average can also hide one outlet with little delivery. Keep the individual samples alongside any summary.
If the far end is repeatedly weaker, compare the actual layout and running conditions with the drip product specification. If one outlet differs while its neighbours are similar, a local inspection is a useful next step. Equal outlet flows do not establish that every plant receives enough water: emitter placement, root coverage, soil and plant needs remain separate questions.
Based on source 2.
05Repeat one change and keep the original record
Use the same outlets, measurement interval and running zone after one approved maintenance change. Write both sets of observations. “Before: 100/95/60 mL; after: 100/96/94 mL; three minutes each” preserves what changed. It does not establish which hidden condition caused the original difference.
If the second test does not reproduce the first, investigate collection consistency and operating changes before buying parts. Keep an unresolved result marked as unresolved. Use the uneven-watering guide for a structured next check, or the regulator guide when you need to compare estimated zone demand with a specific component’s operating range.
Work with your own numbers
Timed-collection calculator
Use the same collection duration for all three comparable outlets. The starting volumes are the illustrative example above; replace them with your observations.
Three samples describe these outlets only. The minimum-to-maximum ratio is not a distribution-uniformity audit or a pass/fail threshold. A missing or spilled sample must be repeated, not entered as zero. Inputs are not saved by the tool.
Take a useful record away
Timed-collection record
Print this guide and keep one row of notes for each repeated test. The calculator does not store your entries.
- Zone; line and exact sampled outlet locations
- Emitter model, rated flow and adjustable settings
- Collection time; near, middle and far volumes, with units
- Supply or zone conditions that changed during the test
- Maintenance change; repeat observations; next check
Use your browser’s Print command, or “Print guide” at the top, to print or save a PDF.
Check the original guidance
Sources & verification
Sources checked on . First published . Follow the manual for your exact model if its instructions differ.
- UC Agriculture and Natural Resources: emitter evaluations and discharge sampling
- Utah State University Extension: backyard drip irrigation, layout and plant needs
Diagrams and the order of checks are YardOnAuto’s explanatory presentation of the cited guidance, not manufacturer installation drawings.
Our editorial method